Tag Archives: statistics

The impact of the Russia ban on Judo

With the Ukraine invasion by Russia, the sporting world has joined nations in placing sanctions on Russia. The IJF has banned Russian Athletes from competing.

In this article we briefly examine the impact this may have on Judo events in 2022.

Hypothesis

Russia is considered a string Judo nation, the men’s team at London2012 was dominant for example. The ban of Russian athletes may weaken Judo events.

Methodology

Using the Webservice::Judobase module and Perl programming language collect all the inscriptions from events across multiple years and sum the events and number of Russian athletes.

Results

Raw initial data:

{
          '2015' => {
                      'Russians' => 815,
                      'total_events' => 59
                    },
          '2016' => {
                      'Russians' => 734,
                      'total_events' => 58
                    },
          '2017' => {
                      'Russians' => 718,
                      'total_events' => 58
                    },
          '2018' => {
                      'Russians' => 824,
                      'total_events' => 62
                    },
          '2019' => {
                      'Russians' => 763,
                      'total_events' => 60
                    },
          '2020' => {
                      'Russians' => 165,
                      'total_events' => 18
                    },
          '2021' => {
                      'Russians' => 492,
                      'total_events' => 38
                    }
        };

Discussion

The data shows a big drop in participation in 2020 and 2021. This could be in due to:

  • Prior/Existing bans
    The doping scandals had already impacted Russian participation and caused calculation of metrics more difficult as athletes have competed under different flags such as RJF (Russian Judo Federation).
  • Pandemic
    2020 to now has been impacted by the COVID-19 pandemic, with event cancellations and travel limitations. Also the 2020 Olympic games were delayed till 2021.
  • Geographic diversity
    A presumption can be made that Russian athletes are attending in larger number the events closer to them geographically. So an exploration of events to see what events Russian’s were attending and compare the impact would be of interest.

Extended data

By including athletes who participated as RUS, RJF (Russian Judo Federation) or ROC (Russian Olympic Committee) we can obtain a better count of Russian athletes.

{
          '2015' => {
                      'Russians' => 815,
                      'total_events' => 59
                    },
          '2016' => {
                      'Russians' => 734,
                      'total_events' => 58
                    },
          '2017' => {
                      'Russians' => 718,
                      'total_events' => 58
                    },
          '2018' => {
                      'Russians' => 824,
                      'total_events' => 62
                    },
          '2019' => {
                      'Russians' => 763,
                      'total_events' => 60
                    },
          '2020' => {
                      'Russians' => 165,
                      'total_events' => 18
                    },
          '2021' => {
                      'Russians' => 523,
                      'total_events' => 38
                    }
        };

This boosts the numbers in 2020, where Russian athletes competed in Tokyo2020 under their Olympic Committee flag.

Another sample we can explore is the numbers from 2022 up till now:

{
          '2022' => {
                      'total_events' => 55
                    }
        };

This is for inscription for all of 2022, taken on 17 March 2022. So majority of inscriptions are till early April; however their are some inscriptions as far ahead as the December 2022.

Surprisingly the data did not show any Russian athletes have participated in events in the first quarter of 2022.

Summary

The invasion of Ukraine by Russia is a terrible thing and the impact of the International Judo Federation banning of the nation is a small triviality compared to the loss of life, harm and lives thrown into turmoil.

However, as trivial it is in comparison; it will have an impact on the sport of Judo.

Further research

It would be interesting to explore the medals won by the Russian athletes along with participation numbers to determine the change in depth of talent in the events.

If you are interested in exploring this, I would like to assist.

2016 Junior WRL Statistics

The IJF World Ranking Lists are valuable sources of metrics for researchers. This article includes some simple statistics gained from the 2016 IJF Junior WRL.

2016 IJF Junior Athletes

These charts can make it easy for interested people to visualise the dispersal of athletes across both weight classes and continental unions.

From this you can easily see that the W-57kg and M-73kg categories are the most popular and that majority of athletes are from the EJU. Comparing Male to Female you can see a difference in the overall shape of the charts. It would appear that the females have a more even distribution of athletes across females with male athletes being skewed towards the lighter weights.

As coaches, researchers or administrators these simple statistics might be useful for decision making processes. For example event organisers might identify the need to attract more heavyweight junior males to participate in events.

The IJF world ranking lists are freely available from the IJF.org website and this site would welcome contributed articles based on investigations into the Cadet, Junior and Senior IJF World Ranking Lists.

Tre Torri Judo Tournament Corridonia – 2009 B-Tournament – Porto Sant’Elpidio, Italy (ITA)

In this post we shall use the JudoInside.com website again to explore a Judo competition and the data we are able to obtain from this freely available source. Today we shall look at the Tre Torri Tournament held recently in Italy, the event is a B tournament and was well attended and this event was choosen to look at as the British Team attended including many of it’s 2008 Beijing Olympic players.

We shall look at the men’s categories, not for any other reason than to save time, we shall not look at the female categories. Using JudoInside.com we are able to collect some data on the percentage of fights each athlete has won on an annual basis. This is data available on the JudoInside.com website on June 18th 2009, so is limited by the completeness of the information available on that site. There are some obvious anomalies  in the data, but for the purposes of this post we will just accept them.

So lets look at the raw data:

Raw data from Tre Torri Judo TOurnament 2009

From left to right what this data shows is the number of fights JudoInside.com had recorded in the “Head to Head” statistic (including fights prior to 199). This is followed by the athletes name and then by the past decade of results. The results consist of a percentage of fights won by the player according to the website. The final column is an average of all the percentages from 1999-2009. Below the main table is a summary of the average percentage for each of the medalist types and also the number of fights recorded for each medal type.

The summary information shows immediately an interesting statistic, the winners of the categories had many more fights on the system than the players they beat, and this was consistent between second and third place winners also. This might be used to support a hypothesis that Judo success requires a certain level of competition experience. That without having competed in enough events you will not win.

This is only one data point and should not be looked at in isolation.
We need to consider the level of this competition, it is a B tournament, not an elite level competition, yet we have players like former World Champion Craig Fallon, Olympian Eaun Burton and of course Tamerlan Tmenov. The long contest record of Tamerlan Tmenov for example affects the averages. Francesco Bruyere and Tamerlan Tmenov are the only two players to have a record in each year for the full decade.

So lets chart the data above:

Chart of winning percentages across past decade at Tre Torri 2009

This is a bit messy, but if you look carefully you can see some interesting information about the athletes. For example, the density is clearly higher in the last 4 years, perhaps indicating the length of careers of players in this event. Comparatively few athletes have careers extending over more than 4 or 5 years. This information might support a hypothesis that there is a optimum length of career, which might become part of a long term athlete development plan if proven. If we were to simplify the chart or chart each athlete separate out athletes you might be able to determine trends in victory percentages, which could be used to assess if an athlete is progressing well or slipping perhaps.

After doing some simple analysis like this in a spreadsheet, it might be interesting to look at a variety of charts and see if anything comes to eye. A simple way to do this is to import the data into Swivel and let it’s automated system create some visually pleasing charts for us. And we can easily see for example the following summary of 2008:

2008 by Athlete

Where we see that no athlete had an unbeaten year, and that the Italian player Giovanni Di Cristo was statistically at least, the best player in the bunch. We can also see pretty clearly in this next chart (below) which players are the most experienced.

Total Fights by Athlete

This is just a quick summary of the event and yet it gives some insights that might be relevant to a coach of B Tournament level players, or even of an elite level coach looking to learn more about the players in the level below him and how they progress upwards (and in this case downwards). It could be interesting to researchers looking to discover more about our sport.

The data is available on Swivel, so please do take a look and leave a comment on this site telling me what you discover or find interesting.

Attack rates in Judo.

The following post is another summary of the work done by Dave Elmore of Wolverhampton University, who is a colleague of mine on the University of Bath Foundation degree. This piece of research was done as part of the Bath course and Dave has kindly allowed me to share it here. For those not aware of the course at Bath, it is a fantastic learning opportunity for any person dedicated to Judo. It covers everything from the Origins and HIstory of Judo to the latest scientific research and modern Judo waza, not to forget Kata also. Applications for the 2010 intake are open now, so please do visit the website and consider signing up.

Scores at 2008 Prague Judo World Cup

What the chart above shows us very simply is when scores were achieved in matches at this event, broken into 30 second segments. This chart is based on the toal number of score across categories. You can see that during the 21-90 second mark the number of scores is reaches a peak, then drops off; followed by another peak at 271-330 seconds.

This data can be interpretted in a number of ways as players, coaches, physiologists and analysts. Tactically, we can look at this and suggest that our training programmes need to prepare our Judo athletes to expect higher work rates at these two peaks. Strength and Conditioning be it in the gym or in the Dojo could be modelled around the structure shown in the chart.

Of course there is more to the story than this, we need to look deeper before making radical changes to our training regimes.
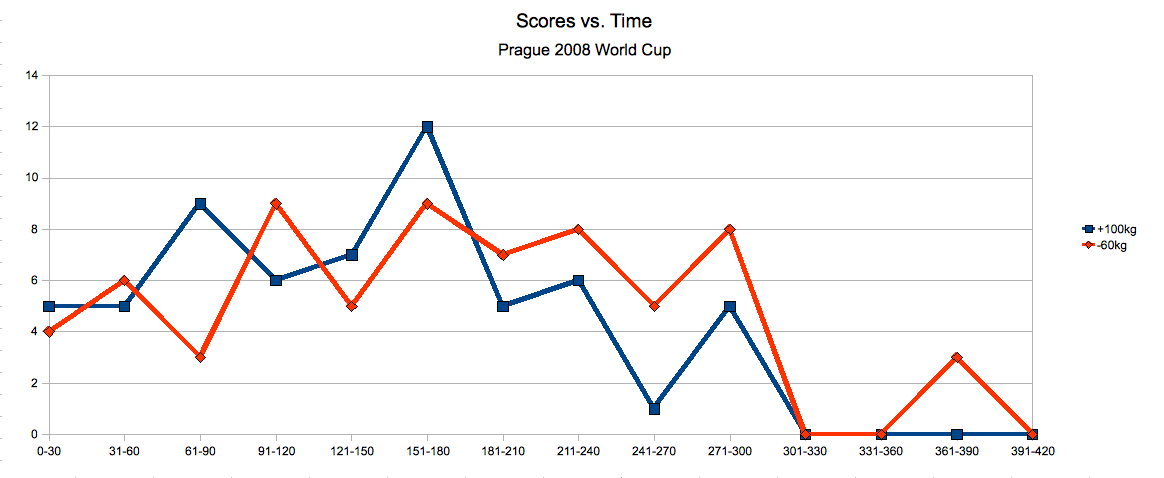
For example, we need to look at the weight category that your Judo athletes are competing in, below are chart is from the -60kg and +100kg categories, does it tell a different story?

Scores Vs. Time 2008 Prague Judo World Cup

The above chart shows some differences between weight categories that are interesting. The +100kg category shows a marked drop off in scoring after the peak at 151-180 seconds. The -60kg players appear to show a more consistent scoring pattern across the duration of the matches. This may be purely due to the physical characteristics of the players in these weights, we do not know.

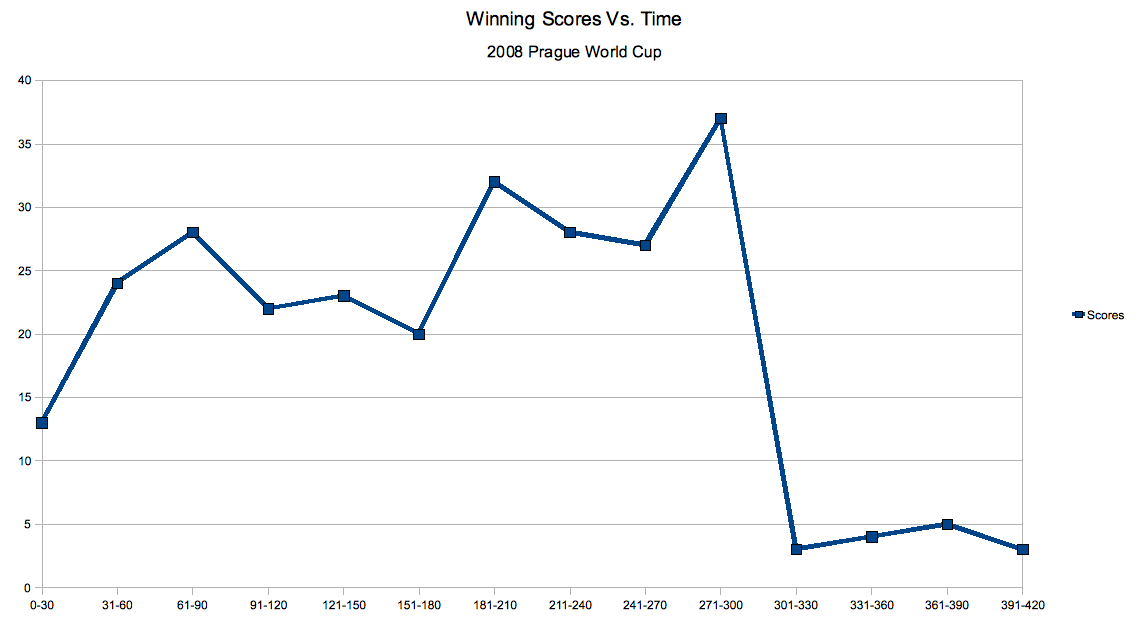
Both the charts above include all scores in the matches, which is interesting but argueably less interesting that when the decisive, winning score occurs in a match. Luckily, we have this information too.

Winning Scores vs. Time

The chart above suggests that there is a period of risk after around one minute, around three minutes and finally near the end of the match. The numbers of scores in these “hot spots” increases as the match goes on. The “dips” may indicate periods where players are resting? Perhaps we can train players to attack in the dips, where the majority of players are not scoring? This is one perspective of the data at least. Again this is data covering all attacks and all categories, lets look more closely at the data for individual categories.

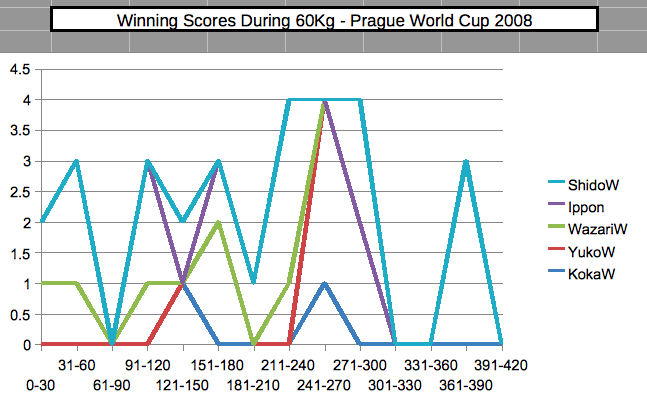
Judo -60kg winning scoresThis chart shows when the scores that won the matches occured in the -60kg category of the 2008 Prague World Cup. From this we can infer that the period from 211 seconds through 300 seconds is the “hotspot” at which point you are at the greatest risk of being scored against (or of course you have the greatest opportunity for scoring). Players can be trained (potentially) using methods that capitalise on this identified “hotspot”.
Here, for the first time we also see shat scores are occurring when. Shido is sadly the most common score. Let us now look at a entirely new category, the -81kg category.

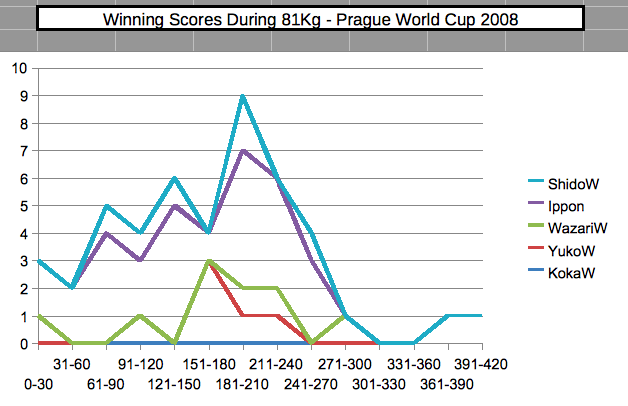
picture-4This chart of the -81kg category of the 2008 Prague World Cup shows a very different shape to matches. Here there appears to be a steady increase in scoring up to the 181-210 mark, at which there is a sharp decline. There are a variety of ways this information might be used; perhaps if your athletes can be trained to withstand the onslaught leading up to the 211 seconds mark they might profit from planning their own barrage later in the match?
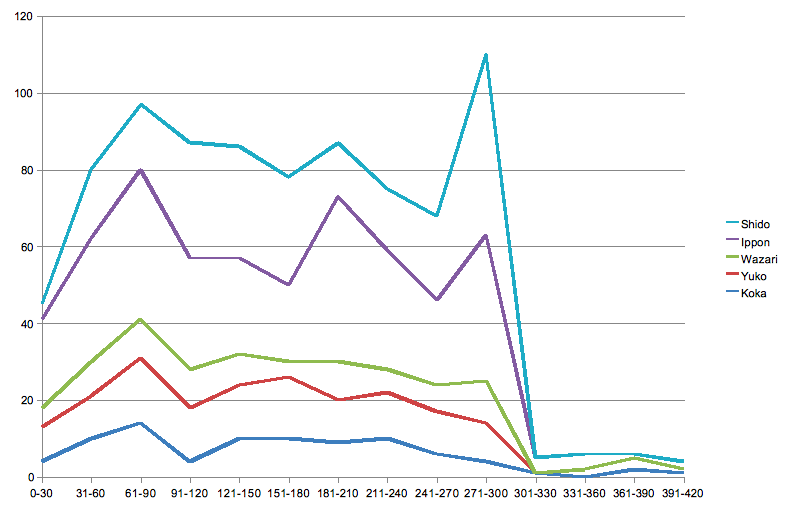
What is also interesting in this category is the large gap between Shido and Ippon scores and Wazari, Yuko and Koka scores. There is also what looks like a clear relationship between the Ippon and Shido scores, the peaks are consistently at the same places. What does this suggest? Why is there a difference between this category and the -60 fighters?

Perhaps at this point it is worth considering the overall scoring rate again, but look at the individual scores rather than an amalgamated chart:

Scores vs. Time

This chart shows some interesting data that might be of interest. For example, the jump in Shido scores at 271-300 might show the penalties that accrue as a player ahead on points defends their lead at the end of a match. It is also clear that Shido is the top socre in this event, followed by Ippon, Wazari, Yuko and lastly Koka.

Perhaps it is data like this that served as proof to the IJF to scrap the Koka in international competition, seeing as it is clearly the least frequest score. Perhaps now that Yuko incorporates (some) Koka a future investigation might have Yuko more frequent than Wazari?

In terms of player preparation, can we apply what the data shows us? Should we be teaching/training Koka Judo? Is it an effective use of training time? Even at the “golden score” (301-420) stage of the fight Koka is infrequent. Should more time be dedicated in training to preventing or generating Shido?

The data from this study is fascinating, and it is interesting to consider the implications it might have in modern Judo preparation and competitive tactics and strategy. This sort of study and our own analysis of it in terms of our own specific situations may highlight potential changes in training or performance Judo that we can implement.

To close, I would like to thank Dave Elmore once more for sharing the data he collected with me and allowing me to share it online. Dave is doing great work which is not only statistical in nature. here in the UK he is perhaps better known for his work in the Advanced Aprenticeship In Sporting Excellence JUDO (and blog). If anyone is interested in enrolling for this course in September 2009 here is a document which gives more information and contact info: what-is-aase-word-doc.

Lance.

An examination of BJA Dan Grades (part one).

So far, a majority of the information shared on this site has been about performance Judo and the metrics associated with competition Judo. This is, of course, just a subset of the Judo world, so this article is not about elite performance Judo rather about the demographics of a Judo association.

Future Black Belt
Picture by MikeOliveri

The British Judo Association (BJA) maintains a record of all Dan grades (Black belts and above) within their orgainsation. They also make this  information partially available via their website at http://britishjudo.org.uk/technical/grading_dan_register.php which means that I was able to peruse that data and make some basic analysis.

Before we begin, we should consider that the website of the BJA is not kept up to date, the Dan grade register should not be considered accurate. Also, the information is not made available in a easy to access format, you can reach only one record at a time. So to conduct any analysis of the information the first step was to scrape the BJA website and pull the data into a MySQL database where queries could be run. The data scraping process can introduce errors into the information.
Finally, the register provides no information on past grades or if the people listed are alive, deceased, members or retired. There are anomalies in the data such as the total number of entries in the database not equalling the number of grades at each level, this is caused by inconsistencies/errors in the data. This data was collected on March 26th 2009.

Simple descriptive statistics about the BJA dan grade register.

Male Dan Grades:        9941 (84.22%)
Female Dan Grades:        1862 (15.78%)

If we focus on female Dan grades, we can compare this to the general population of the BJA by referring to the BJA 2007/08 Annual Report.

A quick analysis of this data shows the following:

Male:        20226 (75.56%)
Female    :      6541 (24.44%)

Now if we compare these two basic percentages, we see right away that despite women being approximately a quarter of the Judo population, less than 16% are Dan grades. We do not have enough information to make any inferences as to why this is, but we can suggest there is an issue here that needs addressing by the BJA. Why is their an imbalance between male and female when compared to the wider Judo population. Is it a case of institutional sexism, or are there other forces at work, like for example maternity.

The general population also includes children, so we should not read too much into this difference in percentages. However, it does perhaps suggest that the BJA (and Judo more widely) should research this area and try and determine if there is an actual difference and if so, why it is occurring and when.

It would also be interesting to compare these participation levels to other sports such as Tennis, Dance, Rugby, Wrestling, TKD or Karate. We might find that Judo participation levels by females and at the Dan Grade may be good rather than poor. The percentage of girls aged 14-15 that do not participate in any active sports, on a weekly basis, is around 15% to 20%  (Balding, J. (2004). Young people in 2003. Exeter: Schools Health Education Unit.), so how would this fit with our numbers?

The Dan grade register data also has information such as area, club and date of the grading, analysing this information shall be the subject of later posts. You may also wish to take a look at the data yourself, the part that formed the basis of this post is available at http://www.swivel.com/data_sets/show/1017786 it has the data and some nice charts too.

Statistical Summary of Judo at 2006 Commonwealth Judo Tournament.

The text below is the result of the pilot study that was the inspiration for my BSC. research project at University of Bath on the Beijing Olympic games Judo event. The study looks at the attack rate of players in the 2006 Commonwealth Judo tournament and their success rate. I have posted it previously on www.judocoach.com/judo but have decided to add it here as it is in keeping with the subject of this site.

Summary of the 2006 Commonwealth Judo Tournament.

Introduction:
At the 2006 Commonwealth Tournament, a study of the attacks,
scores and durations of bouts was made. Eighty-nine bouts were successfully notated. The results
have been collated and analysed and this document is a summary of the findings.
Full details on the study and methodology are being developed so to make them available to
everyone. The hope is that this will encourage others to conduct similar studies.
Statistics:
Descriptive Statistics
Total Fights 89
Total Scores 139(no penalties)
Total Attacks 1305
Total Penalties 100
Total Segments 732
Total Match Time 259Minutes 101.45Recovery time in fights
Total Actual Time 360Minutes 1.14Recovery per fight
Total Possible Contest Time 432Minutes 0.14Between segments
Fights won by Blue 47 53%
Fights won by White 42 47%
Fights won by person who attacks most 61 69%
Fights won by person who attacks least 28 31%
69 33%
21 10%
61 29%
58 28%
Total: 209
Scores per fight (AVG) 1.56
Attacks per fight (AVG) 14.66
Penalties per fight (AVG) 1.12
Segments per fight(AVG) 8.22
Of Actual time on mat 72%
Of time allocated 83%
Scores per segment 0.19
Attacks per segment 1.78
Penalties per segment 0.14
Ippons Scored
Wazaris Scored
Yokus Scored
Kokas scored
(incl Penalties)
Findings for players and coaches:
By averaging out the results of the data collected, we are able to describe an average Judo bout at
the Commonwealth Tournament level.  An average fight at commonwealth level consists of the
following:
Each match is approximately four minutes long, and consists of eight “segments” of action.
Each segment of approximately 30 seconds in duration, with 14 seconds between each segment.
Within each segment we can expect 1-2 attacks only before Matte is called.
We can expect a score every 7-8 segments, this score will be Ippon 1/3rd of the time. The other
two thirds of the time it will be divided almost equally between Koka & Yoku. Wazari will be
scored infrequently (only 10% of the overall scores).
Given this description of an average match, we are able to develop coaching strategies and
training sessions to best simulate commonwealth level Judo. Sessions could be developed
following approximately the following format.
Endurance drill:
Athlete attacks at near maximal level for 30 seconds.
They then recover for 14 seconds
The above two steps are repeated 8 times.
This drill helps develop the athletes ability to give maximum effort for entire match for difficult
matches.
Tactical Drill:
Athlete fights for grip for 10 seconds
Coach calls “NOW”, and athlete must make one large attack
Athlete then continues to grip fight for 10 seconds
Coach calls “NOW”, and athlete must make one large attack
Athlete recovers for 14 seconds
Repeat above steps eight times.
This drill trains the athlete to make maximum use of the available time. Minimising risk of
passivity attacks whilst keeping energy expenditure minimal.
Active defence Drill:
Athlete is attacked constantly for 30 seconds, they must only defend.
At 10 seconds the coach shouts “NOW”, the athlete must make some form of positive attack.
At 20 seconds the coach shouts “NOW”, the athlete must make some form of positive attack.
At 30 seconds the coach shouts “NOW”, the athlete must make some form of positive attack, this
attack must be “terminal”, concluding on the floor or outside safety area.
Recover for 14 seconds
Repeat above steps eight times.
Summary
This document is a very basic analysis of a small amount of information from the 2006
Commonwealth Tournament. It is hoped that this documents shows how this form of study and
analysis can provide interesting insights which can be applied to training programme
development.
Further analysis of the data is under way and a more detailed document will follow.
The use of simple mean averages provides generalised information which provides only an
indication of general trends in the data analysed. This needs to be considered when developing
training programmes.
For example, the four minute figure mentioned in this document is a mean average of all the
fights recorded. The range of durations went from a few seconds to over twelve minutes spent on
the mat.
Similarly, the mean averaged number of segments, covers all stages in a competition. Initial
examination of the data showed a visible change in contest structure in the later stages of a
category. This included more segments, hence more attacks, but with each segment being sorter.
Your athlete may be better served by drills that followed this pattern over the average format of a
Commonwealth level Judo match
Full details of this research are available via the www.JudoCoach.com
website and/or by contact the author, Lance Wicks, directly at the email
address: lw@judocoach.com. Fellow researchers are invited to contact Lance
Wicks to source the data and digital copies of the notation forms, etc.
It is hoped that this research will act as a catalyst, encouraging further
research within the sport by researchers both with and without experience.
Kia Kaha, Kia Toa, Kia Manawanui
Be brave, Be Strong, Be Perservering
(Old New Zealand Maori Saying)
(c)2006, Lance Wicks. www.judocoach.com lw@judocoach.com

Reblog this post [with Zemanta]

JudoMetrics: Re-stating my assumptions.

Recently I have been involved in two conversation threads related to, but seperate from this site. The first was about my BSc. research project notating the attack rate of Judo athletes in the Beijing Olympic Judo Tournament. The second is a thread about Talent Identification in Judo and generally. Also there have been a couple of posts in the Judo Blogosphere about Malcolm Gladwells “Outliers” book that helped inspire this post.

In both conversations my response has been that if we can identify the factors needed, then we should be able to predict future results. As per Max Cohen in the movie Pi, I decided to “re-state my assumptions” as I think it will help set the context for this website better for visitors.

Assumption 1: If we can identify the right metrics, we can predict results.

So, what I mean is if we knew what caused a player to win a Judo match, then we could track this for two players before (or during) a match and predict the victor.

Evidence: If player 1 has beaten player 2 ten times in ten matches, then we could fairly comfortably predict that player 1 will beat player 2 in their next match. If player 3 has won all their pre-liminary fights by Ippon we can start predicting that Player 4 will lose to player 3 by Ippon.

The “ah yes, but…“:

The problem is that Judo is very complex, (argueably) more so than other sports. In Rugby Union for example, the team that retains possesion and territory will generally win. It is not always the case, but it is a performance metric that works in a sport where there are (again argueably) more variables to consider than in Judo. There are 30 players not 2 (more if you count subsitutions), there is weather conditions etc. Yet the simple metrics of possesion and territory can give a pretty good prediction of results.

So rather than say it is not possible to predict Judo using metrics, I argue that it is possible and that we just have yet to research well enough to find the metrics that matter.

Whether we ever are able to measure enugh worthwhile information to predict results of individual matches… we shall see. Also, whether we will be able to use these metrics for anything other than academic use is questionable also. I am not sure that we can coach players to fight certain ways as the statistics say it will result in a victory. So perhaps Judo metrics will never be an “applied science”.

Personally, I suspect that performance metrics will prove useful.
Assuming we can discover the right things to measure and we are able to interpret the results appropriately. “Knowledge is power” they say, we already know that countries like Germany and France are compiling information/knowledge about the players their players will meet, in terms of throws they use etc. It is not that big a leap from this to them also collecting statistics on throw frequencies and scoring ratios etc.

I suspect that we could increase our success in Judo if we were able to analyze more knowledge (metrics) about players from other countries.

Talent ID and Judo Metrics

I believe that we can predict the result of matches through Judo metrics, I also believe that we can/could predict who would be a good Judoka; if we can assess enough variables. We may not be able to predict accurately, but we could identify likely candidates. We have some evidence to support this via the soviet era sport and more recently in China.

Summary

It may well be the case that JudoMetrics is as realistic science as Psychohistory and it may well be “bunkum“, but IMHO it is worth researching further, at least to a point where we have a better view of it and can decide if it is the future or snake oil. It may be that on this site I am pursueing an idea as mad as Max Cohen’s in Pi…  time will tell.